Flexible and efficient data visualization capabilities meet the needs of various business analysis scenarios with precision.
Request a demo
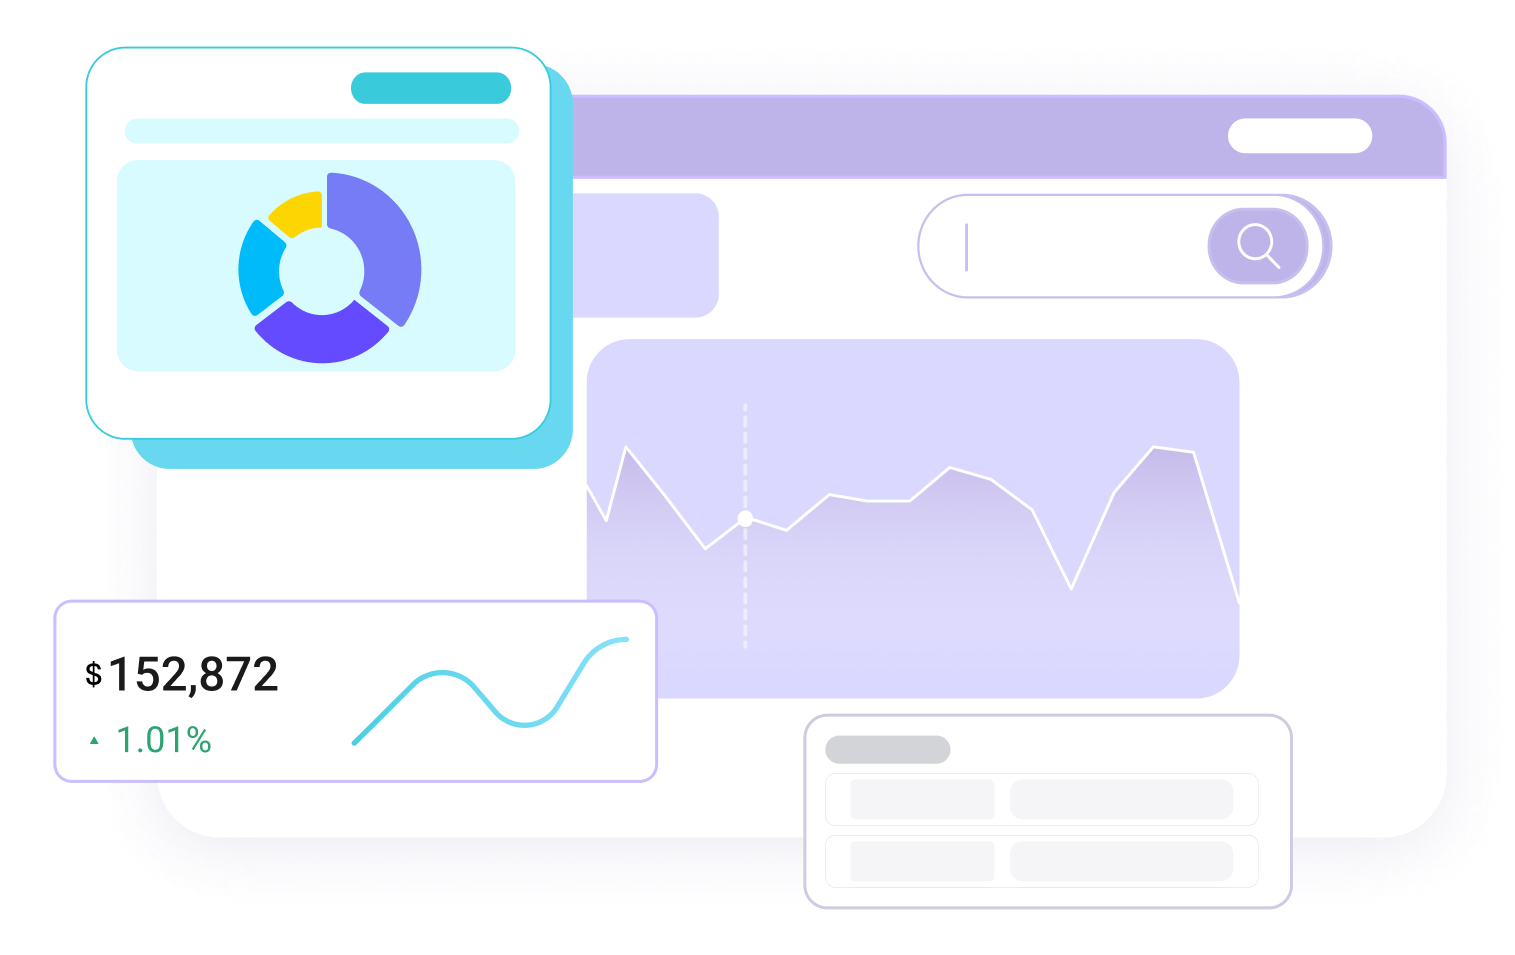
Rich visualization reports
Let data speak, enabling efficient insights
Dashboards offer a variety of report styles, including line charts, pie charts, retention charts, and Sankey diagrams. Through analytical models, different business characteristics can be set and displayed on the dashboard, helping to quickly understand business data and detect anomalies.
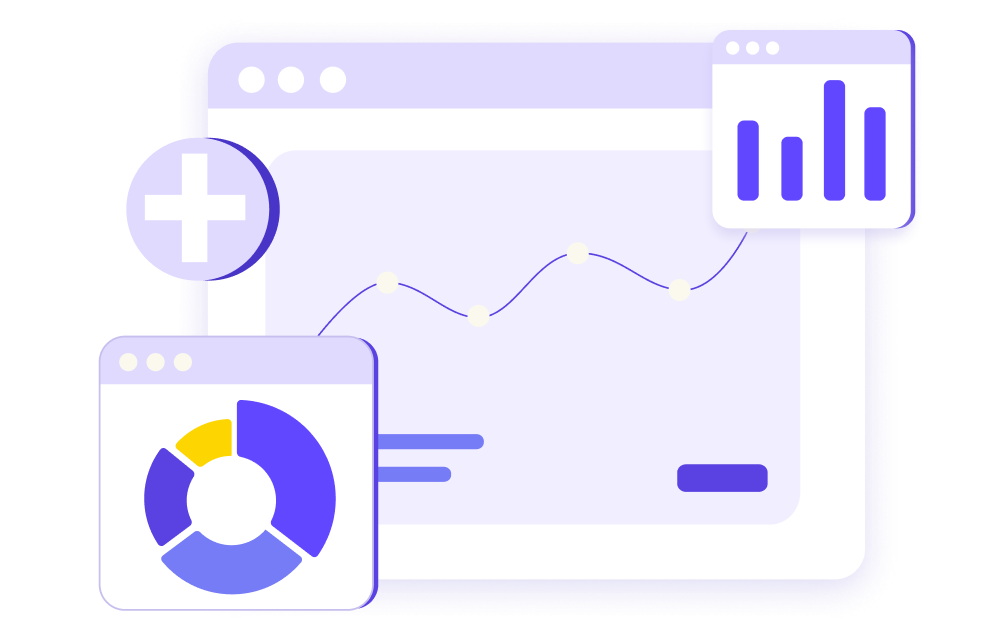
Convenient dashboard configuration
Multi-dimensional data presentation to meet business analysis needs
Dashboards provide convenient condition settings, allowing filtering based on time zones, periods, regions, and other conditions, meeting the needs of different businesses and detailed data analysis.
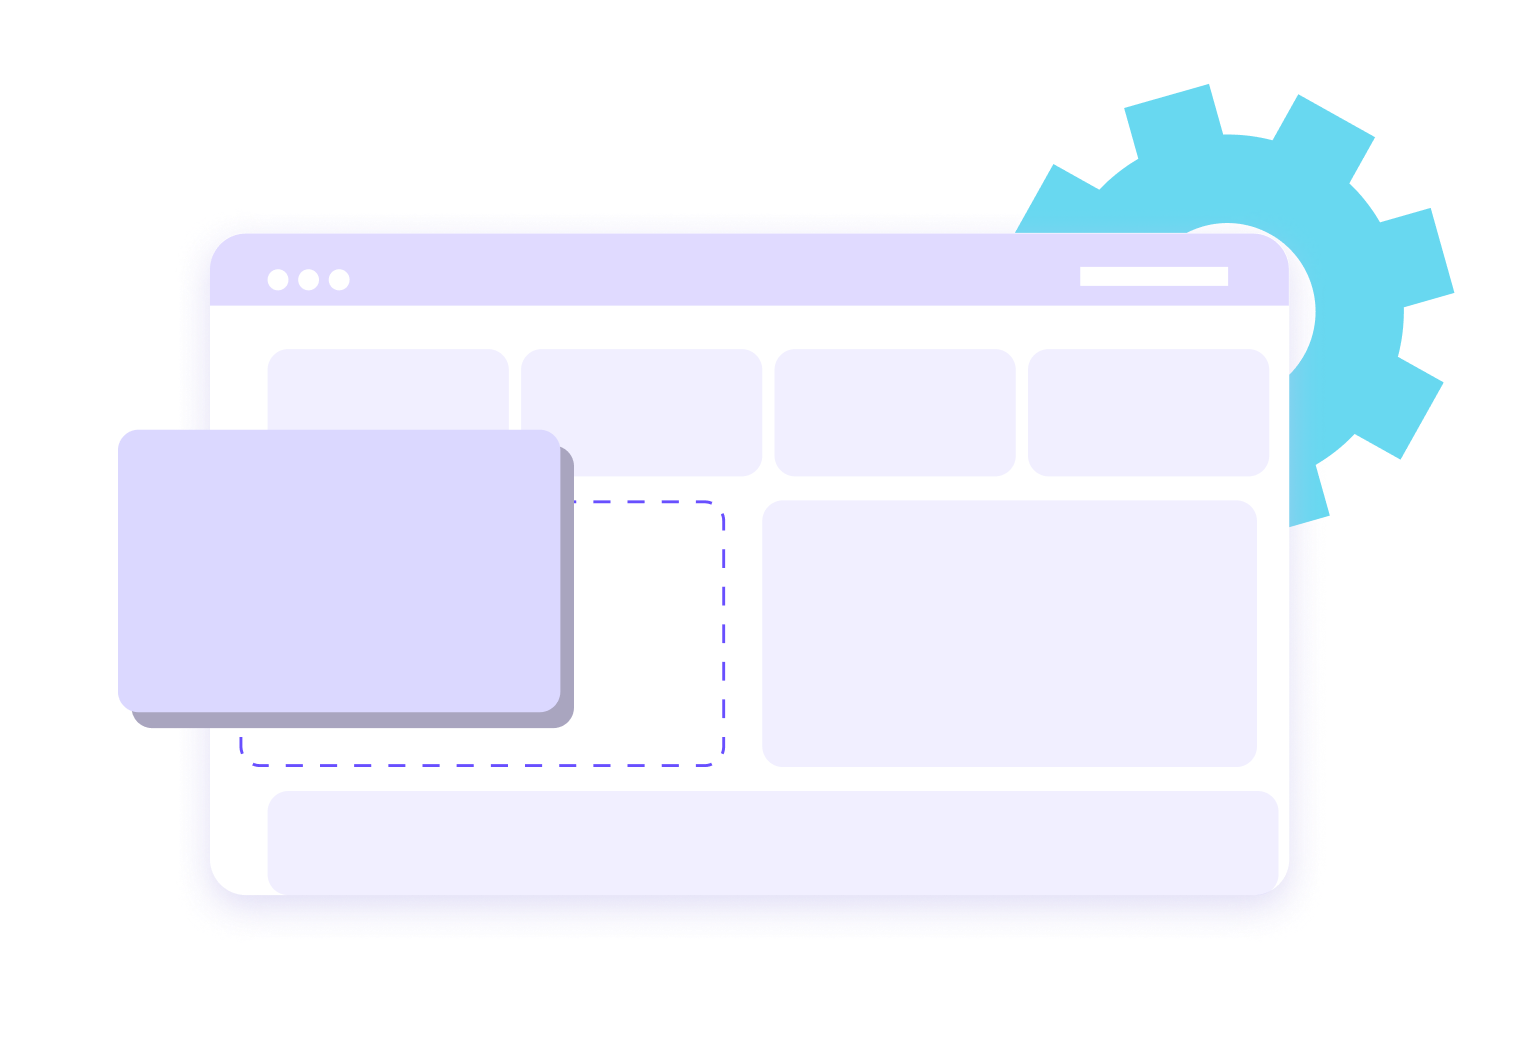
Comprehensive dashboard management
Efficient team collaboration, balancing knowledge accumulation and data security
Dashboards can be managed through folder categorization for knowledge accumulation. By creating shared spaces, personal experience can be transformed into team knowledge, while also managing viewing permissions for users at different levels to ensure data security.

Start a new growth journey now
Request a demo